The steadily rising demand for electricity is currently growing at 3.4% annually. Electric vehicle adoption is accelerating and the charge points infrastructure to accommodate them follows. U.S. charge points number is forecasted to jump from 4 million to 35 million by 2030. The energy requirements from data centers are growing apace with the wide-ranging adoption of AI. In the US, the strain on the grid is rising fast as data center inventory grew by 24.4% year-over-year in Q1 2024 alone. These power-hungry AI and data centers are expected to double their electricity consumption by 2030.
Yet, the power grid is not aging gracefully and struggles to adapt. It was predominantly built in the 1960s and 1970s when demand was considerably lower and stabler. Instead of the initial stable fossil fuel-based power production with a steady output, it must now accommodate more cost-effective renewable energy sources. Unfortunately, the grid was not built with fluctuating power input in mind, preventing the efficient use of renewable energy and contributing to costly grid congestion.
The Current US Grid Infrastructure Drawbacks
A combination of factors hampers the rapid upgrade of the US power grid.
Aging Infrastructure
Over 70% of U.S. transmission lines are nearing 25 years old, and many are nearing or past their 50–80-year lifecycle.
To accommodate the high demand, conductor wires operate near or beyond their operational envelope. Unfortunately, this wire overuse has consequences that are liable to create more problems than they solve.
Overload heats the wire, increasing resistance in the wires and weakening them, which leads to energy loss, dangerous sagging, and accelerated wear and tear.
In theory, there are two ways to rejuvenate the grid. Replacing transmission lines or building new ones. However, practical considerations stand in the way of both.
Replacing the lines, though technically feasible, would have an unacceptable impact, as it requires extended and uninterrupted long outages and over substantive areas. So that is not a practicable option.
That leaves building new lines as the only viable option. However, the price tag is problematic, and the building pace is unlikely to match the rise in electricity demand. The estimated 10 years required to build new lines is due mainly to pre-construction factors such as regulatory hurdles, buying the planned route land from individual sellers, and raising the money for the project. With an estimated cost of $3-6.5 million per mile and transmission lines spanning thousands of miles, the bill is not to be trifled with, and raising the necessary funds further slows down the process.
As a result, high-voltage transmission construction has fallen from 1,700 miles a year in the early 2010s to 925 miles annual average from 2015 to 2019, and a mere 350 miles a year between 2020 and 2023. So, neither replacing nor expanding the transmission lines is a realistic option to accommodate the rising demand in the coming years.
Grid Congestion
The next best option is to optimize the current grid infrastructure and limit grid congestion, preferably without unpopular fixes such as curtailment or flexible load.
The two main directions to achieve that are reducing transmission bottlenecks and improving monitoring.
Balancing the Transmission Grid
Transmission bottlenecks used to be mainly due to line capacity fluctuations, as high wind, freezing temperatures, and heat alter transmission lines’ physical properties. Line geometry across terrain geographies significantly impacts winds’ regime, a fundamental factor in cooling lines to a better operational temperature.
Rapidly identifying the span with the lowest capacity, which can be called ‘the critical span’ that dictates the maximum load between two substations, and adjusting the load accordingly is the best way to compensate for transmission bottlenecks.
This requires continuous, exhaustive, and locally precise line monitoring.
The Current State of Monitoring
Traditional, line monitoring relies on line and tower mounted sensors. Due to deployment and maintenance costs, those sensors are placed miles apart and monitor only a fraction of the transmission lines, leaving most spans unmonitored.
To compensate for this lack of visibility, ambient and static line ratings based on evaluations of transmission line capacity correlated with weather conditions define the appropriate load for vast sections of the grid at a time.
This discrete type of monitoring lacks immediacy and precision, and the maximum load is based on theoretical safety parameters rather than on real-world, real-time information.
All these monitoring shortcomings can be overcome by using optical fiber sensing. Their ability to provide continuous information about the transmission lines’ condition and capacity is the fastest way to shrink the financial costs of grid inefficiency.
Financial Costs
Congestion queues
Managing interconnection queues is a complex, multistep process. It requires feasibility studies, system impact assessments, and facility studies before signing an Interconnection Agreement (IA). This leads to delays and backlogs. Several projects (81% between 2000-2018) exit the queue due to high costs, feasibility issues, or other insurmountable hurdle.
When they progress past the IA hurdle, projects take a median time of five years to become operational.
At the end of 2023, about 12,000 projects were seeking grid interconnection. With nearly 2,600 GW of active capacity in queues and historical completion rates (~14%), the unrealized economic value could be worth billions annually.
Direct Financial Impact
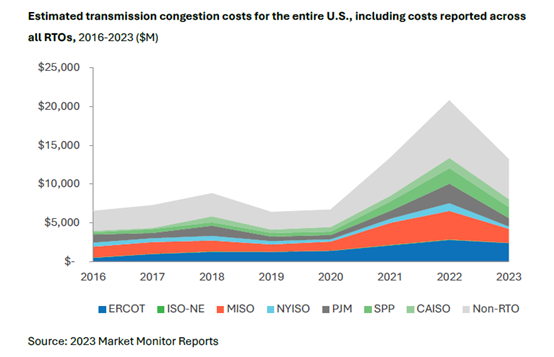
Insufficient grid capacity drives up costs for U.S. consumers by causing congestion, with reported transmission congestion costs reaching $8 billion in 2023, according to a 2024 Grid Strategies Transmission Congestion report. Across the U.S., this scales to $11.5 billion, all paid by consumers. It also limits access to low-cost renewable energy, hindering clean energy goals and grid reliability.
Downstream Financial Impact
Outages directly affect businesses and private residences. Business downtime leads to lost revenue, decreased productivity, and damage to equipment. They disrupt remote work, communications, and critical services (e.g., ATMs, emergency response), disproportionately affecting homes doubling as workplaces.
The total costs to residential and commercial customers in the United States between $1.5 and $3.5 trillion by the year 2050. Manufacturing industries, 12.8% of private sector value, experience 36.8% of supply chain losses due to power disturbances.
A single event, the widespread outages during Hurricane Sandy, left New Yorkers without power for up to 2 weeks, causing $18 billion in local damages.
Outages directly affect businesses and private residences, some of which double as workplaces. Business downtime leads to lost revenue, decreased productivity, and damage to equipment. They disrupt remote work, communications, and critical services (e.g., ATMs, emergency response), disproportionately affecting homes that double as workplaces.
The total costs to residential and commercial customers in the United States between $1.5 and $3.5 trillion by the year 2050. Manufacturing industries, 12.8% of private sector value, experience 36.8% of supply chain losses due to power disturbances.
A single event, the widespread outages during Hurricane Sandy, left New Yorkers without power for up to 2 weeks and caused $18 billion in local damages.
Outages also have health impacts that strain the healthcare system and increase related costs. A U.K. study reported a 114% increased emergency visits among elderly patients during prolonged outages in cold weather and a 9.16× higher odds of heat exhaustion during heatwaves, exacerbating conditions like diabetes and respiratory diseases.
The benefits of continuous capacity monitoring
Continuous line monitoring, with technology such as optical fiber sensors, has multiple benefits:
It facilitates improving load capacity by providing continuous and localized information about individual span conditions and capacity. This increases the accuracy of the operational envelope, reducing reliance on capacity limits dictated by discrete information and relying on conservative worst-case scenario safety criteria.
Optic fiber sensing identifies critical spans in real-time, and the built-in Direct Line Rating (DLR) automatically adjusts the load to dynamically optimize the grid capacity.
One more important aspect of keeping track of the changing critical span, the one that sets the limit for the entire line, is the reduction of risk to line assets. If one span is not being cooled as the rest of the line and the ampacity of the line increases, sending more power, this one span faces risks (attached equipment, insulation, and other assets). By monitoring the critical span, unnecessary damage is avoided while more capacity is gained. A win-win scenario for the consumers and the grid.
Learn more about Prisma Photonics’ Grid Enhancing Technology at https://www.prismaphotonics.com/solution/prismacapacity/